What 7 frontier AI developers have published about the energy, emissions, sites
and power sources behind their models, against Epoch AI's estimates of their training
compute.
Models at or above 1e25 FLOP with a published training-emissions figure
Joined by this site: Epoch AI's compute estimates against this site's index of published footprints. A lifecycle figure covering months of use is not counted as a training figure.
Environmental Disclosure Index
This siteLicenceMITUpdatedquarterlyRetrieved
, 5 days ago
Data7 datasetsOur own reading of what frontier developers and the operators of their data centres have published about training energy, emissions, power sources and energy per prompt, with permits and press reporting marked separately from company statements. Most cells record an absence. Company figures are self-reported and mostly unaudited, and market-based emissions reflect contracts rather than the grid at the hour of use.CiteAI Safety Tracker, "Environmental Disclosure Index". https://aisafetytracker.org/environment/. Retrieved 23 October 2026.
Notable AI Models
Epoch AILicenceCC-BY-4.0UpdatedweeklyRetrieved
, 5 days ago
Inclusion is editorial ("notability criteria"), not exhaustive. Compute figures are frequently estimates; check the per-row confidence and notes columns before treating any value as measured.CiteEpoch AI, "Notable AI Models". https://epoch.ai/data/ai-models. Retrieved 23 October 2026 via AI Safety Tracker, https://aisafetytracker.org/environment/.
1 of 24
Llama 3.1-405B. No figure is published for any model by OpenAI, Anthropic or xAI, or for any Gemini model.
Google data-centre electricity that was carbon-free in the hour it was used, 2025
Environmental Disclosure Index
This siteLicenceMITUpdatedquarterlyRetrieved
, 5 days ago
Data7 datasetsOur own reading of what frontier developers and the operators of their data centres have published about training energy, emissions, power sources and energy per prompt, with permits and press reporting marked separately from company statements. Most cells record an absence. Company figures are self-reported and mostly unaudited, and market-based emissions reflect contracts rather than the grid at the hour of use.CiteAI Safety Tracker, "Environmental Disclosure Index". https://aisafetytracker.org/environment/. Retrieved 23 October 2026.
65%
Against 100% matched over the year by renewable purchases. No other operator publishes the hourly figure.
Google's figure for the median text prompt in Gemini Apps
Environmental Disclosure Index
This siteLicenceMITUpdatedquarterlyRetrieved
, 5 days ago
Data7 datasetsOur own reading of what frontier developers and the operators of their data centres have published about training energy, emissions, power sources and energy per prompt, with permits and press reporting marked separately from company statements. Most cells record an absence. Company figures are self-reported and mostly unaudited, and market-based emissions reflect contracts rather than the grid at the hour of use.CiteAI Safety Tracker, "Environmental Disclosure Index". https://aisafetytracker.org/environment/. Retrieved 23 October 2026.
0.24Wh
May 2025, with a published method. OpenAI states 0.34 Wh for an average query, without one.
Google's electricity emissions at the grid's average intensity, 2025
Location-based and market-based scope 2 emissions, from Google's 2026 Environmental Report.
Environmental Disclosure Index
This siteLicenceMITUpdatedquarterlyRetrieved
, 5 days ago
Data7 datasetsOur own reading of what frontier developers and the operators of their data centres have published about training energy, emissions, power sources and energy per prompt, with permits and press reporting marked separately from company statements. Most cells record an absence. Company figures are self-reported and mostly unaudited, and market-based emissions reflect contracts rather than the grid at the hour of use.CiteAI Safety Tracker, "Environmental Disclosure Index". https://aisafetytracker.org/environment/. Retrieved 23 October 2026.
15.1MtCO2e
2.8 MtCO2e once its renewable contracts are subtracted. Data centres drew 42.4 TWh, up from 30.6 TWh the year before.
Largest reported training run
Compute is Epoch AI's estimate, not a disclosure.
Notable AI Models
Epoch AILicenceCC-BY-4.0UpdatedweeklyRetrieved
, today
Inclusion is editorial ("notability criteria"), not exhaustive. Compute figures are frequently estimates; check the per-row confidence and notes columns before treating any value as measured.CiteEpoch AI, "Notable AI Models". https://epoch.ai/data/ai-models. Retrieved 28 October 2026 via AI Safety Tracker, https://aisafetytracker.org/environment/.
9.4e26FLOP
GPT-6 Astra, OpenAI, 2026-09. No energy use, site or emissions figure is published for it.
What we know
What each developer has published about the energy behind its models, and what
permits and press reporting add. 12 of 28 entries record nothing
published.
OpenAI
largest run 9.4e26 FLOP, GPT-6 Astra
Training energy or emissions
Not disclosed
No energy or emissions figure for any model.
Where it trains and serves
Published
Stargate sites built with Oracle and SoftBank. The first, at Abilene, Texas, runs on Oracle Cloud Infrastructure.
OpenAI
What powers those sites
Reported by others
Permits filed for on-site natural-gas turbines at the Abilene campus. OpenAI publishes no energy figure for any site.
DCD
Energy per prompt
Published
0.34 Wh for an average ChatGPT query, June 2025, stated without a method.
Sam Altman
xAI
largest run 5.0e26 FLOP, Grok 4
Training energy or emissions
Not disclosed
No energy or emissions figure for any model.
Where it trains and serves
Reported by others
Grok 3 was trained on Colossus, a converted factory in Memphis, Tennessee.
R&D World
What powers those sites
Reported by others
Colossus 1: 15 on-site gas turbines, 247 MW, permitted in July 2025. Around 35 ran before the permit was granted. Colossus 2: dozens of 35 MW gas turbines across the state line in Southaven, Mississippi, permitted in March 2026.
DCDWDAM
Energy per prompt
Not disclosed
No per-prompt figure.
Meta
largest run 5.2e25 FLOP, Llama 4 Behemoth (preview)
Training energy or emissions
Published
GPU hours and emissions in every Llama model card since Llama 2. Llama 3.1 405B: 8,930 tCO2e location-based.
Llama 3.1 model card
Where it trains and serves
Partly published
Meta's own GPU clusters. Which site trained a given model is not stated.
Llama 3.1 model card
What powers those sites
Published
100% of electricity matched with renewable energy since 2020, so market-based training emissions are reported as zero.
Llama 3.1 model card
Energy per prompt
Not disclosed
No per-prompt figure.
Google DeepMind
largest run 5.0e25 FLOP, Gemini 1.0 Ultra
Training energy or emissions
Not disclosed
No energy or emissions figure for any Gemini model. The Gemma 3 model card no longer carries the pre-training figure it once gave.
Where it trains and serves
Partly published
Google's own data centres. Which sites train or serve a given model is not stated.
Google
What powers those sites
Published
65% carbon-free energy hour by hour across Google's data centres in 2025, and 100% matched with renewable purchases over the year.
Google
Energy per prompt
Published
0.24 Wh, 0.03 gCO2e and 0.26 mL of water for the median Gemini Apps text prompt, May 2025, with a published method.
Google
Anthropic
largest run 3.4e25 FLOP, Claude 3.7 Sonnet
Training energy or emissions
Not disclosed
No energy or emissions figure for any model.
Where it trains and serves
Published
Amazon's Trainium clusters including Project Rainier, Google TPUs, and from May 2026 all of SpaceX's Colossus 1 in Memphis, over 300 MW.
AmazonGoogleSpaceX
What powers those sites
Reported by others
Colossus 1 holds a permit for 15 on-site gas turbines. Amazon and Google state 100% annual renewable matching for their own consumption. Anthropic publishes no energy figure.
DCDAmazonGoogle
Energy per prompt
Not disclosed
No per-prompt figure.
DeepSeek
largest run 9.7e24 FLOP, DeepSeek-V4-Pro
Training energy or emissions
Partly published
GPU hours only: 2.788 million H800 GPU hours for DeepSeek-V3. No energy or emissions figure.
DeepSeek-V3 report
Where it trains and serves
Not disclosed
Not stated.
What powers those sites
Not disclosed
Not stated.
Energy per prompt
Not disclosed
No per-prompt figure.
Mistral AI
largest run 7.7e23 FLOP, Mixtral 8x7B
Training energy or emissions
Published
Lifecycle analysis of Mistral Large 2: 20.4 ktCO2e and 281,000 m3 of water for training and 18 months of use, to January 2025.
Mistral AI
Where it trains and serves
Not disclosed
Not stated in the lifecycle analysis.
What powers those sites
Not disclosed
Not stated in the lifecycle analysis.
Energy per prompt
Published
1.14 gCO2e and 45 mL of water for a 400-token Le Chat response.
Mistral AI
"Published" means the developer's own model card, report or statement. "Reported by others"
means a permit, a regulator or the press, with the developer silent. A company's
clean-energy claims cover its whole operation, never one model. Largest runs are Epoch AI's
compute estimates for models published since 2020.
Our own reading of each developer's publications. Every claim links to where it was made.
Environmental Disclosure Index
This siteLicenceMITUpdatedquarterlyRetrieved
, 5 days ago
Data7 datasetsOur own reading of what frontier developers and the operators of their data centres have published about training energy, emissions, power sources and energy per prompt, with permits and press reporting marked separately from company statements. Most cells record an absence. Company figures are self-reported and mostly unaudited, and market-based emissions reflect contracts rather than the grid at the hour of use.CiteAI Safety Tracker, "Environmental Disclosure Index". https://aisafetytracker.org/environment/. Retrieved 23 October 2026.
Notable AI Models
Epoch AILicenceCC-BY-4.0UpdatedweeklyRetrieved
, 5 days ago
Inclusion is editorial ("notability criteria"), not exhaustive. Compute figures are frequently estimates; check the per-row confidence and notes columns before treating any value as measured.CiteEpoch AI, "Notable AI Models". https://epoch.ai/data/ai-models. Retrieved 23 October 2026 via AI Safety Tracker, https://aisafetytracker.org/environment/.
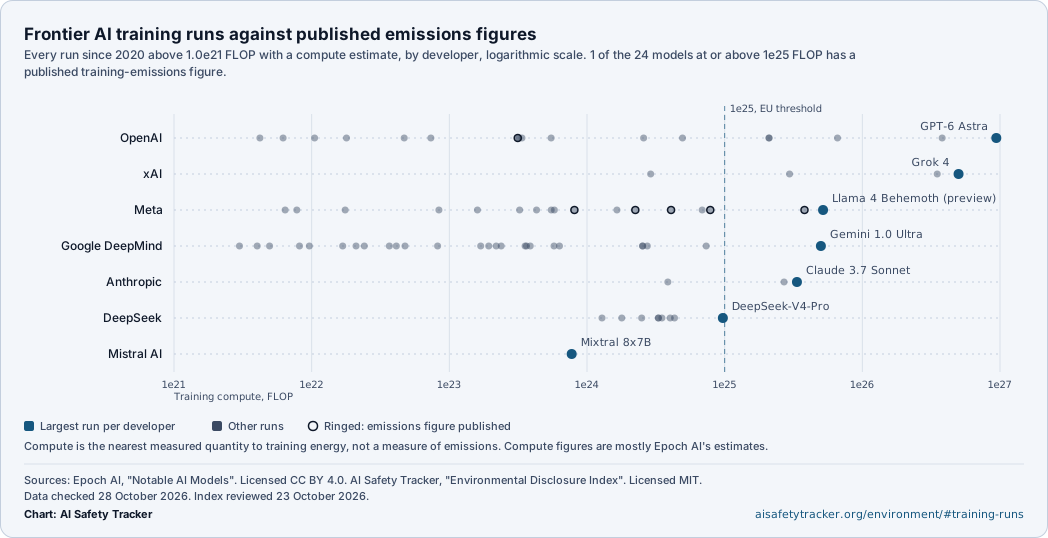
How big the training runs are
Every run since 2020 above 1.0e21 FLOPFloating-point operation. Training compute is reported as the total number of operations used in the final training run, on a logarithmic scale, so each axis step is ten times the one below it.Glossary entry with a compute estimate, by
developer, on a logarithmic scale. The largest per developer is named.
Largest run per developer
Other runs
Ringed: emissions figure published
Compute is Epoch AI's estimate. Whether emissions are published is this site's index.
Notable AI Models
Epoch AILicenceCC-BY-4.0UpdatedweeklyRetrieved
, today
Inclusion is editorial ("notability criteria"), not exhaustive. Compute figures are frequently estimates; check the per-row confidence and notes columns before treating any value as measured.CiteEpoch AI, "Notable AI Models". https://epoch.ai/data/ai-models. Retrieved 28 October 2026 via AI Safety Tracker, https://aisafetytracker.org/environment/.
Environmental Disclosure Index
This siteLicenceMITUpdatedquarterlyRetrieved
, today
Data7 datasetsOur own reading of what frontier developers and the operators of their data centres have published about training energy, emissions, power sources and energy per prompt, with permits and press reporting marked separately from company statements. Most cells record an absence. Company figures are self-reported and mostly unaudited, and market-based emissions reflect contracts rather than the grid at the hour of use.CiteAI Safety Tracker, "Environmental Disclosure Index". https://aisafetytracker.org/environment/. Retrieved 28 October 2026.
Use this figure
An SVG image of this figure, with its sources, date and address printed in it, linked to
this section. SVG file. All
embeddable figures.
<a href="https://aisafetytracker.org/environment/#training-runs"><img src="https://aisafetytracker.org/embed/training-runs.svg" alt="Strip chart of frontier AI developers' training runs by compute, with the runs that have a published training-emissions figure ringed, from AI Safety Tracker" width="1048" height="538" loading="lazy" style="max-width:100%;height:auto"></a>
The ten largest training runs with a compute estimate, and whether any energy or
emissions figure has been published for each.
Model
Developer
Compute, FLOP
Published
Training emissions
GPT-6 Astra
OpenAI
9.4e26
2026-09
Not published
Grok 4
xAI
5.0e26
2025-07
Not published
GPT-4.5
OpenAI
3.8e26
2025-02
Not published
Grok 3
xAI
3.5e26
2025-02
Not published
GPT-5
OpenAI
6.6e25
2025-08
Not published
Llama 4 Behemoth (preview)
Meta AI
5.2e25
2025-04
Not published
Gemini 1.0 Ultra
Google DeepMind
5.0e25
2023-12
Not published
Composer 2.5
Cursor
3.9e25
2026-05
Not published
Llama 3.1-405B
Meta AI
3.8e25
2024-07
Published
Claude 3.7 Sonnet
Anthropic
3.4e25
2025-02
Not published
Compute is the nearest measured quantity to training energy, and not a measure of emissions.
The energy a run needs is its compute divided by the efficiency of the chips it ran on,
which improves with each hardware generation, and the emissions are that energy times the
carbon intensity of the grid behind the data centre, which no developer on this chart
states for its largest run. Compute figures are mostly Epoch AI's estimates, faintest
where developers publish least, and cover the final training run only.
Training footprints that have been published
Every published figure for the energy or emissions of training a model, with who measured
it and on what basis. Emissions per 1e24 FLOP are computed here where both figures exist.
Published training energy and emissions by model, with the basis of each figure and
emissions per unit of compute.
GPT-3 175B Final training run, estimated by Google researchers from published details. OpenAI has published no figure.
BLOOM 176B Final training run, dynamic power only, on the Jean Zay supercomputer in France. 50.5 tCO2e including idle power and hardware manufacture.
Llama 2 70B Pre-training. The card states the emissions were fully offset.
DeepSeek-V3 GPU hours only. No power, energy, location or emissions figure.
Llama 3 70B Pre-training. The card states the emissions were fully offset.
Llama 3.1 405B Training. The largest training run with a published emissions figure.
Mistral Large 2 Training and 18 months of use to January 2025 together, on a lifecycle basis, so not comparable with a training-only figure.
Llama 4 Maverick Pre-training.
Llama 4 Scout Pre-training. No figure is published for Llama 4 Behemoth, the largest Llama 4 run.
Location-based emissionsEmissions from electricity counted at the average carbon intensity of the grid a data centre drew from, whatever contracts the operator holds.Glossary entry use the average carbon
intensity of the grid the data centre drew from;
Market-based emissionsEmissions from electricity after subtracting renewable energy the operator bought by contract. A company matching all its annual use with renewable purchases can report close to zero while its data centres draw fossil power at some hours.Glossary entry subtract renewable
energy bought by contract, which is how
Llama 3.1 405B is reported at 8,930 tCO2e on one basis and zero on
the other. Energy marked * is derived here from the model card's GPU hours and stated power
per chip. Per unit of compute, the published figures differ
26-fold, from the French grid under BLOOM to the
older chips and grid under GPT-3, whose figure is an outside estimate. Compute for each
model is Epoch AI's estimate.
Emissions per 1e24 FLOP computed by this site from the published emissions figure and Epoch AI's compute estimate for the same model.
Environmental Disclosure Index
This siteLicenceMITUpdatedquarterlyRetrieved
, 5 days ago
Data7 datasetsOur own reading of what frontier developers and the operators of their data centres have published about training energy, emissions, power sources and energy per prompt, with permits and press reporting marked separately from company statements. Most cells record an absence. Company figures are self-reported and mostly unaudited, and market-based emissions reflect contracts rather than the grid at the hour of use.CiteAI Safety Tracker, "Environmental Disclosure Index". https://aisafetytracker.org/environment/. Retrieved 23 October 2026.
Notable AI Models
Epoch AILicenceCC-BY-4.0UpdatedweeklyRetrieved
, 5 days ago
Inclusion is editorial ("notability criteria"), not exhaustive. Compute figures are frequently estimates; check the per-row confidence and notes columns before treating any value as measured.CiteEpoch AI, "Notable AI Models". https://epoch.ai/data/ai-models. Retrieved 23 October 2026 via AI Safety Tracker, https://aisafetytracker.org/environment/.
Energy per prompt
Every per-prompt figure a developer has published. Each measures a different statistic.
0.24 Wh
Google, median text prompt, Gemini Apps, May 2025.
0.03 gCO2e.
0.26 mL of water. Method published.
Source
0.34 Wh
OpenAI, average query, ChatGPT, June 2025.
Method not published.
Source
1.14 gCO2e
Mistral AI, 400-token response, Le Chat, January 2025.
45 mL of water. Method published.
Source
A median prompt and an average query are different statistics: a few very long requests
raise an average and leave a median where it was. None of the three covers image or video
generation, long reasoning or agent runs, and Google's emissions figure uses its
market-based fleet average. Anthropic, Meta, xAI and DeepSeek publish no per-prompt figure.
Environmental Disclosure Index
This siteLicenceMITUpdatedquarterlyRetrieved
, 5 days ago
Data7 datasetsOur own reading of what frontier developers and the operators of their data centres have published about training energy, emissions, power sources and energy per prompt, with permits and press reporting marked separately from company statements. Most cells record an absence. Company figures are self-reported and mostly unaudited, and market-based emissions reflect contracts rather than the grid at the hour of use.CiteAI Safety Tracker, "Environmental Disclosure Index". https://aisafetytracker.org/environment/. Retrieved 23 October 2026.
Renewable claims against the grid
What the operators of frontier data centres report for their own electricity.
Renewable matchingBuying as much renewable electricity over a year as a company uses, through contracts or certificates. Says nothing about whether the power used in a given hour, on a given grid, was clean.Glossary entry counts renewable energy bought over
a year; Hourly carbon-free energyThe share of electricity that was carbon-free in the same hour and on the same grid in which it was used. Google is the only data-centre operator that publishes it.Glossary entry counts what
was clean in the hour and on the grid where it was used.
Data-centre electricity, annual renewable matching, hourly carbon-free energy and
water and cooling statements by operator, from each operator's own publications.
Data-centre electricity rose 38% on 2024. The hourly carbon-free share was 13% across Google's Asia Pacific grid regions and 68% in the United States.
Consumed 41 billion litres of water across its data centres and offices in 2025, up 34% on 2024. States that cooling with water needs less energy than cooling with air. Source
Matched 100% of annual electricity with renewable energy in fiscal 2025. No hourly or per-region figure is published.
Every new datacentre design since August 2024 cools chips in a closed loop that evaporates no water once filled, at a stated nominal increase in electricity use. The first such sites are expected online in late 2027. The existing fleet mixes air and water cooling. Source
Stated in its Llama model cards: net zero operations and 100% renewable matching since 2020.
not recorded
Google, carbon-free share of data-centre electricity by grid region, hour by hour,
2025
Google CFE counts Google's clean-energy contracts in that grid region; grid CFE is the region's own carbon-free share. Both from Google's 2026 Environmental Report.
Environmental Disclosure Index
This siteLicenceMITUpdatedquarterlyRetrieved
, 5 days ago
Data7 datasetsOur own reading of what frontier developers and the operators of their data centres have published about training energy, emissions, power sources and energy per prompt, with permits and press reporting marked separately from company statements. Most cells record an absence. Company figures are self-reported and mostly unaudited, and market-based emissions reflect contracts rather than the grid at the hour of use.CiteAI Safety Tracker, "Environmental Disclosure Index". https://aisafetytracker.org/environment/. Retrieved 23 October 2026.lowest first
Hourly carbon-free energy share of Google's data-centre electricity by grid region in 2025, lowest first, with the grid's own carbon-free share.
Grid region
Google
Whole grid
Relative magnitude
Singapore, Energy Market Authority
5%
5%
Taiwan, Taiwan Power Company
15%
15%
Japan, TEPCO
23%
18%
US, South Carolina
31%
25%
US, Southern Company
42%
33%
US, PJM
57%
40%
US, Tennessee Valley Authority
58%
47%
Ireland, EirGrid
60%
50%
US, Duke Energy Carolinas
65%
57%
US, NV Energy
65%
32%
Show the remaining 12
Hourly carbon-free energy share of Google's data-centre electricity by grid region in 2025, lowest first, with the grid's own carbon-free share. Rows 11 to 22.
Germany, Germany
70%
64%
United Kingdom, National Grid ESO
75%
71%
Belgium, Elia
79%
72%
Netherlands, TenneT
82%
55%
US, Bonneville Power Administration
83%
84%
US, ERCOT, Texas
83%
46%
US, Southwest Power Pool
84%
47%
US, Salt River Project, Arizona
86%
56%
US, MISO
88%
36%
Chile, Sistema Interconectado Central
90%
62%
Denmark, Energinet
92%
89%
Finland, Fingrid
98%
95%
Every operator here matches all of its annual electricity with renewable purchases. Only
Google publishes how much was carbon-free in the hour of use: 65%
across its data centres, and 5% on the Energy Market Authority grid in
Singapore. The remainder came from fossil-fuelled generation on the grid at that
hour. No operator publishes which grid region serves which model, so the regional figures
describe where Google computes, not where any one model runs.
Environmental Disclosure Index
This siteLicenceMITUpdatedquarterlyRetrieved
, 5 days ago
Data7 datasetsOur own reading of what frontier developers and the operators of their data centres have published about training energy, emissions, power sources and energy per prompt, with permits and press reporting marked separately from company statements. Most cells record an absence. Company figures are self-reported and mostly unaudited, and market-based emissions reflect contracts rather than the grid at the hour of use.CiteAI Safety Tracker, "Environmental Disclosure Index". https://aisafetytracker.org/environment/. Retrieved 23 October 2026.
Datacentre electricity to 2035
Electricity used by all datacentres worldwide: the International Energy Agency's estimate
for 2024 and 2025, and its Base Case for 2030 and 2035. The 2035 range spans its four
cases. The AI portion is marked where the agency states one.
All datacentres, estimated
All datacentres, IEA Base Case
Range across the four cases
AI portion, defined differently each year
Every figure is the IEA's, read from Energy and AI (2025) and Key Questions on Energy and AI (2026). The dashed line joins the years the IEA states. Nothing is this site's forecast.
Environmental Disclosure Index
This siteLicenceMITUpdatedquarterlyRetrieved
, 4 days ago
Data7 datasetsOur own reading of what frontier developers and the operators of their data centres have published about training energy, emissions, power sources and energy per prompt, with permits and press reporting marked separately from company statements. Most cells record an absence. Company figures are self-reported and mostly unaudited, and market-based emissions reflect contracts rather than the grid at the hour of use.CiteAI Safety Tracker, "Environmental Disclosure Index". https://aisafetytracker.org/environment/. Retrieved 24 October 2026.
The projections are the IEA's scenarios, and the dashed line joins the years it states without
showing a path it publishes between them. The 2024 AI mark is the share of electricity used by
accelerated servers, which the IEA uses as a proxy and calls imperfect. The 2030 mark is its
AI-focused datacentres in the Base Case, and the 2025 level of that group is not stated in
terawatt hours. The two marks are defined differently and are not joined. The 2035 range runs
from 700 to 1,700 TWh across the IEA's four cases, and its
text does not say which case sets which end. The April 2026 report restates the 2030 total as
around 950 TWh.
Datacentre power by country
AI datacentre capacity by country in Epoch AI's hub, and every datacentre's electricity
by region in the IEA's estimate for 2024. The two measure different things.
AI datacentres, IT power by country
Epoch AI's AI Data Centers hub: power operating on the retrieval date and planned at the last stage of each site's timeline, summed by the country Epoch records.
AI Data Centers
Epoch AILicenceCC-BY-4.0Updatedseveral times a weekRetrieved
, today
The largest AI sites Epoch has found, mostly in the United States. Epoch estimated in September 2026 that they hold 44% of the world's deployed AI compute, with a 90% interval of 23% to 81%. Power, compute and cost are Epoch's estimates from satellite imagery, permits and company statements; four in five IT power estimates fall within a factor of 1.4 of the true value. The owner is the owner of the chips, not necessarily of the building. Capacity after the date of retrieval is Epoch's projection. Coordinates are read from the hub's map page, which publishes them; the downloads do not.CiteEpoch AI, "AI Data Centers". https://epoch.ai/data/ai-data-centers. Retrieved 28 October 2026 via AI Safety Tracker, https://aisafetytracker.org/environment/.United States 33.1 GW of 38.2 GW planned
IT power of the AI datacentres in Epoch AI's hub by country, planned at each site's last stage and operating now, largest planned first. The hub holds 14.2 GW operating and 38.2 GW planned.
Country
Planned
Operating now
Relative magnitude
United States
77 sites
33.1 GW
12 GW
China
5 sites
2.1 GW
731 MW
Malaysia
3 sites
1.1 GW
1.1 GW
United Arab Emirates
1 site
1 GW
0 MW
Portugal
1 site
233 MW
33 MW
Finland
1 site
145 MW
75 MW
Norway
2 sites
134 MW
42 MW
United Kingdom
1 site
88 MW
88 MW
Indonesia
1 site
72 MW
72 MW
Sweden
1 site
48 MW
0 MW
Show the remaining 2
IT power of the AI datacentres in Epoch AI's hub by country, planned at each site's last stage and operating now, largest planned first. The hub holds 14.2 GW operating and 38.2 GW planned. Rows 11 to 12.
Australia
1 site
41 MW
41 MW
Iceland
1 site
10.2 MW
5.1 MW
All datacentres, electricity by region, 2024
The shares are the IEA's, from Energy and AI (2025). The terawatt hours are those shares of the IEA's 2024 world total, multiplied here: the IEA states no regional figure in terawatt hours.
Environmental Disclosure Index
This siteLicenceMITUpdatedquarterlyRetrieved
, 4 days ago
Data7 datasetsOur own reading of what frontier developers and the operators of their data centres have published about training energy, emissions, power sources and energy per prompt, with permits and press reporting marked separately from company statements. Most cells record an absence. Company figures are self-reported and mostly unaudited, and market-based emissions reflect contracts rather than the grid at the hour of use.CiteAI Safety Tracker, "Environmental Disclosure Index". https://aisafetytracker.org/environment/. Retrieved 24 October 2026.415 TWh world total
Share of world datacentre electricity in 2024 by region as the IEA states it, and the
terawatt hours that share comes to.
Region
Share of world
TWh, computed
United States
45%
187
China
25%
104
Europe
15%
62
Rest of the world
15%
62
Power is the capacity a datacentre can draw and electricity is the energy it used, so the tables
cannot be converted into each other: neither source states how fully the capacity is used. The
hub holds 95 sites and is not a census of datacentres. Europe is the IEA's region and
not the European Union. The rest of the world is the remainder after the three regions the IEA
names, and includes Japan, for which it gives no share.
Lawrence Berkeley National Laboratory states 192 TWh for the United States in 2024,
46% of the IEA's world total.
Environmental Disclosure Index
This siteLicenceMITUpdatedquarterlyRetrieved
, 5 days ago
Data7 datasetsOur own reading of what frontier developers and the operators of their data centres have published about training energy, emissions, power sources and energy per prompt, with permits and press reporting marked separately from company statements. Most cells record an absence. Company figures are self-reported and mostly unaudited, and market-based emissions reflect contracts rather than the grid at the hour of use.CiteAI Safety Tracker, "Environmental Disclosure Index". https://aisafetytracker.org/environment/. Retrieved 23 October 2026.
AI Data Centers
Epoch AILicenceCC-BY-4.0Updatedseveral times a weekRetrieved
, 5 days ago
The largest AI sites Epoch has found, mostly in the United States. Epoch estimated in September 2026 that they hold 44% of the world's deployed AI compute, with a 90% interval of 23% to 81%. Power, compute and cost are Epoch's estimates from satellite imagery, permits and company statements; four in five IT power estimates fall within a factor of 1.4 of the true value. The owner is the owner of the chips, not necessarily of the building. Capacity after the date of retrieval is Epoch's projection. Coordinates are read from the hub's map page, which publishes them; the downloads do not.CiteEpoch AI, "AI Data Centers". https://epoch.ai/data/ai-data-centers. Retrieved 23 October 2026 via AI Safety Tracker, https://aisafetytracker.org/environment/.
What this page cannot show
Questions a reader brings that no published source answers.
Energy used by the largest runs
No developer publishes it for any model above 1e26 FLOP.
Which grid serves which model
Inference moves between regions with demand. No operator publishes where a given model
is served from, hour by hour.
Water per model
Published by Google and Mistral AI per prompt, and by Mistral AI for one model's lifecycle.
Chip manufacture
Of the footprints listed here, only BLOOM's study and Mistral AI's lifecycle analysis
count the emissions of making the hardware.
Chinese developers
DeepSeek publishes GPU hours and nothing on power, sites or emissions.
Tokens behind the energy
How much the models are used, as each company states it.